GammaGuardComplete - Test Results
Table of Contents
Abstract
1.0 Test Results – Internal (Camera) Detector
1.1 EIC In-House Calibration of Dose and Dose Rate
1.2 Spencer Manufacturing Dose Calibration Tests
2.0 Test Results – External Detectors
2.1 Summary of Tests Conducted
2.2 CT007-S/EC Detector Tests
2.2.1 Calibration
2.2.2 Dose Rate Dependence
2.2.3 Directional Dependence Test
2.3 CT007-P (Pancake Detectors)
2.3.1 Comparison to Ludlum 44-9
2.2.2 Dose Rate Linearity Test
2.4.1 AM003 Dose Rate Linearity Test
ABSTRACT
Purpose of EIC GammaGuard System
The EIC family of GammaGuard detectors are designed for use by First Responders who may be required to respond to a radiological emergency. As such the GammaGuard system has been designed to:
· Ensure the personal safety of First Responders by being able to identify “Turn Back Dose Rates” and “Maximum Permissible Doses”. This is provided by the smartphone camera sensor
· Allow First Responders to delineate the appropriate “hot” and “cold” radiological zones. This is provided by the CT007-S and CT007-EC Detectors.
· Measure alpha/beta radioactive contamination on persons and objects. This is provided by the CT007-P Detector
The radiological requirements listed above may be found in CNSC Info Doc INFO - 0754 - 5
The important features of the GammaGuard design include:
· Compact design
· Easy availability
· Ability to measure dangerous levels of radiation
· The capability of replacing other models of radiation detector used during a radiological emergency
· Low cost
· Data logging to an external database
· Simplified use for persons not expert in radiation protection
Table 1: Function of GammaGuard System Components
|
Detector |
Description |
Radiation Type |
Energy Range (keV) |
Dose Rate Range (mSv/h) |
Function |
Physical Dimensions/Weight |
|
Smart Phone |
Camera Sensor |
Gamma |
>40 |
>20 |
Always available, Personal protection, ID dangerous radiation |
NA |
|
CT007-S |
Geiger Survey |
Gamma |
100 - 1100 |
1 - 5000 |
Measure low gamma radiation levels |
5 x 9 x 1.5 cm 65 gm including batteries |
|
CT007-EC |
Compensated Geiger Survey |
Gamma |
40 - 1100 |
1 - 5000 |
Measure low gamma radiation levels |
5 x 10.5 x 1.8 cm 140 gm including batteries |
|
CT007-P
|
Pancake Contamination Probe
|
Alpha/beta/gamma |
NA |
NA |
Measure alpha/beta radioactive material |
5 x 10.5 x 3.5 cm 200 gm including batteries |
|
AM003 |
External Interface to 1.25” x 1.75” NaI(Tl) Detector
|
Gamma |
>40 |
NA |
Specialized gamma surveys |
Interface [5 x 10.5 x 1.8 cm 120 gm]
NaI detector system 4.4 dia x29 cm 410 gm |
The GammaGuard detectors have been subjected to various tests as described in the GammaGuardComplete Test Results Section. The following is a summary of the test results.
Test Results – Internal (Camera) Detector
Accuracy - Accurate within +40% and -20% at dose rate of 1.68 mSv/h from a Cs-137 source
Linearity - Linear within +40% and – 10% between 0.56 mSv/h and 26 mSv/h
High Dose Rate Response - Accurate within 30% at 360 Gy/h for a Co-60 source
Directional Dependence - No directional dependence
Background Noise - Background noise < 0.1 µSv/h
Dose Rate Range - Effective lower dose rate limit is ~ 20 µSv/h. The lower limit is determined by practical limitations on the averaging time required to obtain a steady dose rate reading
Test Results – External Detectors
CT007-S/EC (Gamma Survey Meter)
Accuracy - Within +/- 15% at dose rate of 1.68 mSv/h from a Cs-137 source
Linearity - Linear within +30% and – 20% between 0.007 mSv/h and 5.0 mSv/h
Sensitivity – [Co-60] 45 CPM/µSv/h (based on detector data sheet)
High Dose Rate Response – not tested above 5 mSv/h
Directional Dependence - within 30% at all orientations
Background – 0.1 µSv/h
Dose Rate Range – 0.001 – 5 mSv/h
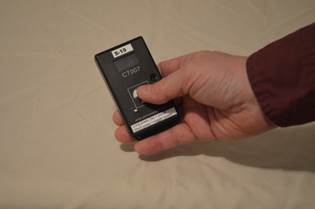
Photo 1: Environmental Instruments CT007-S Gamma Survey Meter
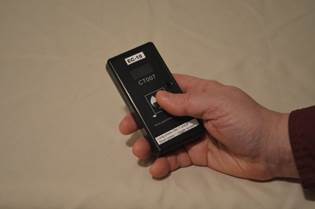
Photo 2: Environmental Instruments CT007-EC Gamma Survey Meter
CT007-P (Pancake Detector)
Accuracy – Energy Dependent
Linearity - NA
Sensitivity – [Co-60] 348 CPM/µSv/h (based on detector data sheet)
High Dose Rate Response – Dead time loses increase at > 600 µSv/h
Directional Dependence - NA
Background - ~40 CPM
Dose Rate Range – NA
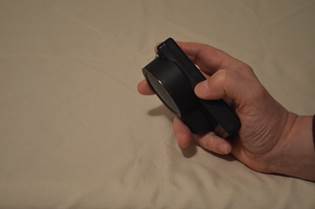
Photo 3: Environmental Instruments CT007-P Contamination Meter
AM003 Interface with NaI(Tl) Detector
Accuracy - Energy Dependent
Sensitivity – 55000 CPM/µSv/h for Cs-137
Background Count Rate – 3000 CPM
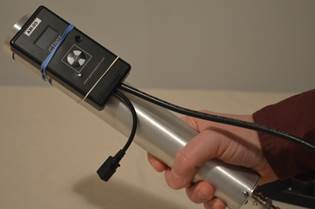
Photo 4: Environmental Instruments AM003 Interface with NaI(Tl) Detector
1.0 Test Results – Internal (Camera) Detector
1.1 EIC In-House Calibration of Dose and Dose Rate
The rear camera sensor was covered with a piece of black electrical tape and the noise reduction described above was performed.
The calibration source consisted of a 10 cm wide x 20 cm long x 5 cm deep box filled with thoriated TIG welding rods. The contact dose rate on the top of this box has been measured to be 10 µSv/h. Photo 1.1 depicts the dose calibrator with a smartphone on it.
A total of 71 Samsung Galaxy S5. Android 5.0 smartphones were tested. Each smartphone was placed on the calibrator box and left there for 2 h.
GammaGuard works by taking a picture, while the camera is covered, and counting the bright pixels. The number of bright pixels (counts) in each frame is proportional to the dose rate (e.g. µSv/h). That value is then multiplied by the time until the next frame (picture) is taken and analyzed. The resulting unit is counts/frame*hour, which is proportional to dose (µSv/h*h = µSv). Readings are expressed per 1000 frames. Thus, GammaGuard's native units for dose rate and dose are counts/1000frames and counts.h/1000frames respectively. Once a conversion factor between counts/1000frames and µSv/h is determined, dose rates and doses can be displayed in standard units (e.g. µSv/h and µSv)
Since each smartphone was initially uncalibrated, the result of the measurement was in units of counts.h/1000 camera frames (c/1000 F).
Figure 1.1 shows the accumulated dose over the two hour period for the SAM 001 and SAM 010 smartphones resting on the calibrator and compares these results with the dose accumulated for the same smartphones at the natural background level.
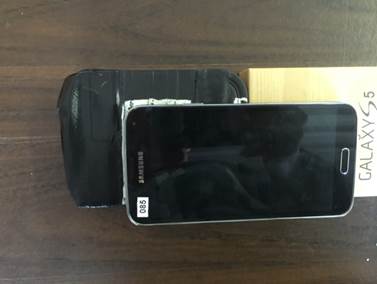
Photo 1.1. Dose Calibrator with a smartphone on it.
|
|
|
Figure 1.1 10 µSv/h Calibrator and Background Measurement Comparison of Smartphone SAM 001 and SAM 010
Figure 1.2 displays the results in total counts.h/1000 F for each of the 71 smartphones.
The average total count.h/1000 F (for 2 h) was 5.6 with a standard deviation of 2.45 (44%). While most of the smartphones yielded a comparable (uncalibrated) count rate there were a number of outliers. In addition to the final uncalibrated response shown in Figure 1.2, Figure 1.3 depicts the counts accumulated for each smartphone as a function of time during the 2 h test. As shown in Figure 1.3, the counts accrued in a linear fashion during the 2 h exposure period although the slope of the lines varied from one smartphone to the other. The different slopes of the lines plotted in Figure 1.3 define the dose conversion factor for each smartphone.
The individual conversion factor [(Ch/1000F) / (µSv/h)] was then entered into each phone.
Figure 1.4 shows the integrated dose recorded by each phone a function of time using the calculated conversion factor for each phone. Since the endpoints (at Time 0 and at Time 120 minutes) are fixed, and since the dose rate was constant, Figure 1.4 provides an indication of the linearity with which each smartphone recorded the dose during the 2 h exposure. While the results for most of the smartphones are close to the mean accumulated dose, some smartphones (e.g., 019) deviated significantly from the expected linearly accumulated dose during the time period between Time 0 and Time 120 minutes.
Figure 1.2 Total Counts.h/1000 F for Each Smartphone
 Figure
1.3 Total Counts.h/1000 F During 2 h Exposure
Figure
1.3 Total Counts.h/1000 F During 2 h Exposure
 Figure
1.4 Accumulated Dose Response of Smartphones During 2 h Exposure
Figure
1.4 Accumulated Dose Response of Smartphones During 2 h Exposure
1.2 Spencer Manufacturing Dose Calibration Tests
After the initial in-house dose calibration of the smartphones, all 71 smartphones were transported to Spencer Manufacturing calibration facilities for testing. (Spencer Manufacturing (1983) Ltd 4728 - 76 Avenue N.W. Edmonton, AB)
The smartphones were subjected to a dose rate of 1680 µSv/h for 4.5 minutes using a Cs-137 source. Figure 1.5 displays the total dose recorded by each smartphone over this period. The mean dose recorded by all 71 smartphones was 142 µSv.
The expected dose from the calibrated facility was 126 µSv. Most of the smartphones (86%) registered a dose within +40 % and -20 % of the expected dose and all but 4 of them were within +60% and -30% The 4 outliers were considered defective and removed from use. The outlying phones in the external test were also typically the outliers in our in-house testing.
 Figure
1.5. Test of Smartphones at Spencer Calibration Facility
Figure
1.5. Test of Smartphones at Spencer Calibration Facility
1.3 Dose Rate Linearity Test
Two representative smartphones (ID Sam 055 and Sam 056) were subjected to varying gamma dose rates at the Spencer facility. The results of the variable dose rate test is presented in Figure 1.6. As shown in Figure 1.6, the dose rate displayed by the two smartphones was within 40% of the expected value throughout the test. There was no obvious dose rate dependence for these two smartphones.
Figure 1.6. Smartphone Dose Rate Response
1.4 Test of Power Save Mode
The dose calibration tests were conducted with the smartphone operating the radiation detection system in the full power mode. Operating the GammaGuard system in the full power mode will drain the smartphone battery in about 2 - 3 h. While the full power mode is useful for the immediate investigation of an incident, it cannot be used for the dose control of emergency responders during an extended response period. Any application that requires measurements over an extended period must be restricted to the use of the GammaGuard system in the power save mode. A good battery will last more than 8 hours in power save mode.
A comparison of the dose measured in the full power mode with the dose measured in the power save mode was conducted using 3 representative smartphones placed on a jig adjacent to an Am-241 point source for 2 h. The purpose of the jig was to provide a fixed position for each smartphone in relation to the Am-241 source.
The results of the comparison are shown in Figures 1.7 to 1.9.
As indicated in Figures 1.7 to 1.9, the Full Power mode and Power Saving mode yield similar doses. The Power Save mode curves are more jagged, because of the reduced sensitivity of the Power Save mode. One radiation event translates into a larger dose and causes a significant "step" in the graph.
Figure 1.7 Full Power Mode and Power Save Mode Accumulated Dose Comparison for Smartphone SAM 060.
Figure 1.8 Full Power Mode and Power Save Mode Accumulated Dose Comparison for Smartphone SAM 080
Figure 1.9 Full Power Mode and Power Save Mode Accumulated Dose Comparison for Smartphone SAM 081
1.5 Directional Dependence
As a test of the directional dependence of the smartphone response, a smartphone (#055) was placed in various positions relative to a Cs-137 source at the Spencer facility and exposed to 1680 µSv/h for 9 minutes.
Table 1.1 provides the measured dose and the position of the smartphone relative to the Cs-137 source. As shown in Table 1.1 there is no discernible difference in the response of the smartphone with the incident angle of the radiation, except when the radiation has to pass through a significant distance inside the phone. This shielding effect has no significance for practical situations.
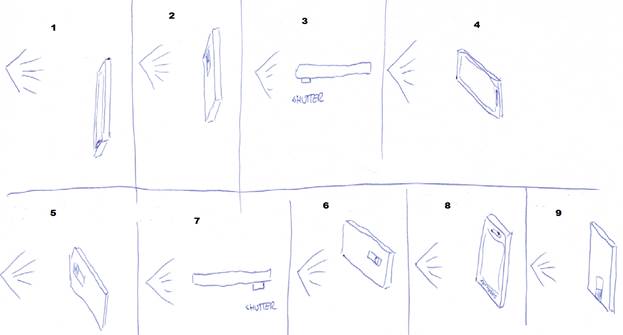
Table 1.1 Directional Dependence of Smartphone Response
|
ID |
Dose (µSv) |
Expected Dose (µSv) |
% Deviation |
Description |
|
1 |
249.6 |
252 |
-1.0 |
Screen side faces source. |
|
2 |
268.5 |
252 |
6.5 |
Shutter / camera side faces source. |
|
3 |
173.2 |
252 |
-31.3 |
Top of the phone faces source. Radiation has to travel ~ 15 mm through case and phone before reaching the camera sensor. |
|
4 |
264.8 |
252 |
5.1 |
Screen side faces source at 45 degrees, rotated about the phone's short axis. |
|
5 |
245.1 |
252 |
-2.8 |
Shutter / camera side faces source at 45 degrees, rotated about the phone's short axis. |
|
6 |
262.5 |
252 |
4.2 |
Shutter / camera side faces source at 45 degrees, rotated in the other direction than before about the phone's short axis. |
|
7 |
118.0 |
252 |
-53.2 |
Bottom of the phone faces source. Radiation has to travel ~ 125 mm through case and phone before reaching the camera sensor. (i.e. significant amount of shielding.) |
|
8 |
247.1 |
252 |
-2.0 |
Screen side faces source at 45 degrees, rotated about the phone's long axis. |
|
9 |
240.8 |
252 |
-4.5 |
Shutter / camera side faces source at 45 degrees, rotated about the phone's long axis. |
1.6 High Dose Rate Response
In order to test the high dose rate response of the GammaGuard system, a Samsung Note 2 smartphone was exposed to a 6 Gray per minute (300 Gy/h) radiation field at the Acsion Industries Co-60 gamma cell at the Whiteshell Laboratories in Pinawa, Manitoba.
Figure 1.10 shows the dose rate recorded by GammaGuard, running on a Samsung Note2 exposed to a 6 Gy/min field for 10 seconds. GammaGuard accurately recorded the dose rate with no indication of saturation.
Figure 1.10 High Dose Rate test of GammaGuard System
1.7 Low Dose Rate Response
GammaGuard uses a proprietary algorithm which allows it to differentiate between true radiation events and noise, resulting in a very low background noise rate. When the noise rate is low, very small radiation fields can be quantified, if the counting time is long enough. That means users can verify GammaGuard's operation, using commonly available products, such as thoriated TIG welding electrodes, as check sources.
To test the efficacy of the GammaGuard noise reduction algorithm, 6 Samsung S5 phones were operated while charging for extended period of time. Measured doses were recorded at approximately 16 and 44 hours.
The results are shown in Table 1.2. The average calculated dose rate were 0.14 and 0.22 µSv/h. The difference is attributed to statistical uncertainty in the counts.
Note that the outlying phone (#068) was also one of the phones that read above + 40% in the test at Spencer Manufacturing. That indicates that the high 14.69 µSv dose after 44 hours is likely due to its dose conversion factor and not due to noise.
Table 1.2 No Source Readings
|
Phone ID |
Reading After 16 Hours (µSv) |
Reading After 44 Hours (µSv) |
|
065 |
1.36 |
9.80 |
|
067 |
1.83 |
7.32 |
|
068 |
3.84 |
14.69 |
|
069 |
2.20 |
9.39 |
|
081 |
1.03 |
7.52 |
|
083 |
3.31 |
8.71 |
|
Average Dose (µSv) |
2.26 |
9.57 |
|
Average Dose Rate (µSv/h) |
0.14 |
0.22 |
2.0 Test Results – External Detectors
2.1 Summary of Tests Conducted
External detectors (CT007-S, CT007-EC, CT-Pancakes, and AM003) were transported to Spencer Manufacturing calibration facilities for testing. (Spencer Manufacturing (1983) Ltd 4728 - 76 Avenue N.W. Edmonton, AB).
Table 2.1 provides a summary of the detectors tested and an indication of the tests conducted.
Table 2.1 Summary of Tests Conducted
|
Detector |
Description |
Number of detectors |
test |
|
CT007-S |
Geiger Survey |
50 |
1680 µSv/h for 4.5 min |
|
CT007-EC |
Compensated Geiger Survey |
7 |
1680 µSv/h for 4.5 min |
|
CT007-S |
Geiger Survey |
15 |
1680 µSv/h for 9 min and 80 µSv/h for 12 min |
|
CT007-S |
Geiger Survey |
1 |
Directional dependence test |
|
CT007- S
CT007-EC
CT007-P
AM003 |
Geiger Survey
Compensated Geiger Survey
Pancake Contamination Probe
External Interface to 1.25” x 1.75” NaI(Tl) Detector
|
1
1
1
1
|
Multi-step dose rate tests |
2.2 CT007-S/EC Detector Tests
2.2.1 Calibration
50 CT007-S and 7 CT007-EC detectors were subjected to a dose rate of 1680 µSv/h for 4.5 minutes using a Cs-137 source. The total dose delivered was 126 µSv. Figure 2.1 (CT007-S) and Figure 2.2 (CT007-EC) displays the total dose recorded by each detector over this period. The mean dose recorded by 50 CT007-S was 111.2 µSv (Figure 2.1) and for the 7 CT007-EC detectors was 120 µSv (Figure 2.2).
All detectors registered a dose within +/-15 % of the 126 µSv dose delivered by the calibration facility.
Figure. 2.1
Figure. 2.2
2.2.2 Dose Rate Dependence
15 CT007-S were subjected to a dose rate of 1680 µSv/h for 9 minutes and subsequently to 80 µSv/h for 12 min from a Cs-137 source. Figure 2.3 displays the deviation (percentage) from the calibrated dose registered by each detector.
Figure. 2.3
One CT007-s and one CT007-EC as representative detectors (ID S-21, EC-1) were subjected to varying gamma dose rates at the Spencer facility. The results of the variable dose rate test is presented in Figure 2.4. As shown in Figure 2.4, the dose rate displayed by CT007-S & EC was within 10% of the expected value throughout 561 to 2409 µSv/h. There was no obvious dose rate dependence for these two detectors except for high dose rate (> 5000 µSv/h).
Figure. 2.4
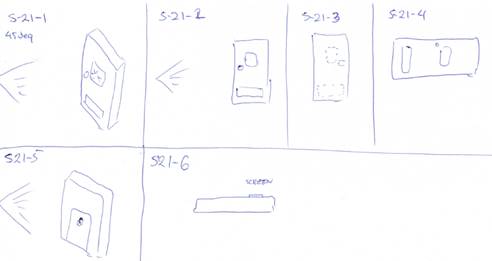
2.2.3 Directional Dependence Test
As a test of the directional dependence of the CT007-S response, CT007-S detectors were placed in six different orientations relative to the Cs-137 source at the Spencer facility. All the detectors were exposed to 1680 µSv/h for 4.5 minutes to yield a total exposure of 126 µSv.
Table 2.2 provides the measured dose and the position of the detector relative to the Cs-137 source. As shown in Table 2.2 there is no discernible difference in the response of the detector with the incident angle of the radiation, except when the radiation has to pass through a significant distance inside the instrument to reach the Geiger detector (Position (ID) 2,4,6).
Table 2.2 Directional Dependence of CT007-S Response
|
ID |
Dose (µSv) |
Expected Dose (µSv) |
% Deviation |
Description |
|
1 |
119.27 |
126 |
-5 |
Screen(OLED) faces source. |
|
2 |
86.4 |
126 |
-31 |
Side (near buzzer) faces source. |
|
3 |
120.96 |
126 |
-4 |
Side (near Geiger) faces source |
|
4 |
87.77 |
126 |
-30 |
Top side faces source |
|
5 |
115.95 |
126 |
-8 |
Back (Battery side) faces Source. |
|
6 |
103.5 |
126 |
-18 |
Bottom side faces source |
2.3 CT007-P (Pancake Detectors)
2.3.1 Comparison to Ludlum 44-9
A CT007-P and a Ludlum Pancake Detector (Model 44-9 with a Model 3 Survey Meter) were subjected to various EIC in-house radioactive sources. Table 2.3 shows that both meters have very similar responses.
Table 2.3, Comparing EIC pancake detector and Ludlum Model 44-9
|
|
KCL |
calibrator box |
Th-rods |
Cs-137 |
Cs-137 [1] |
Cs-137 [2] |
Cs-137 [3] |
Ba- 133 |
Am- 241 |
|
Ludlum [CPM] |
500 |
4800 |
1800 |
16000 |
1700 |
4700 |
10000 |
5000 |
200 |
|
EIC [CPM] |
500 |
5000 |
1900 |
13000 |
1600 |
4600 |
9000 |
5000 |
200 |
Note: Cs [1], [2], [3] are with the same Cs check source at various distances between the source and detector. Most of the counts from this source are from beta radiation.
2.3.2 Dose Rate Linearity Test
A CT007-P was subjected to varying gamma dose rates at the Spencer facility. The results of the variable dose rate test is presented in Figure 2.5.
Figure 2.5 shows that dead time effects become apparent at about 600 µSv/h. This is expected, since the CT00-P GM tube is relatively large and registers more counts at a given dose rate compared to the CT007 Detector series.
Figure. 2.5
2.4 AM003 with NaI(Tl) Probe
2.4.1 Dose Rate Linearity Test
An AM003 equipped with our NaI(Tl) detector was subjected to varying gamma dose rates at the Spencer facility. The results of the variable dose rate test is presented in Figure 2.6.
Figure 2.6 shows that the count rates are high and the response becomes non linear at dose rates in excess of 25 µSv/h.
Figure. 2.6